The next question in industrial security is not just what entered a device. It is what connected devices may be learning to do together.
Executive Summary
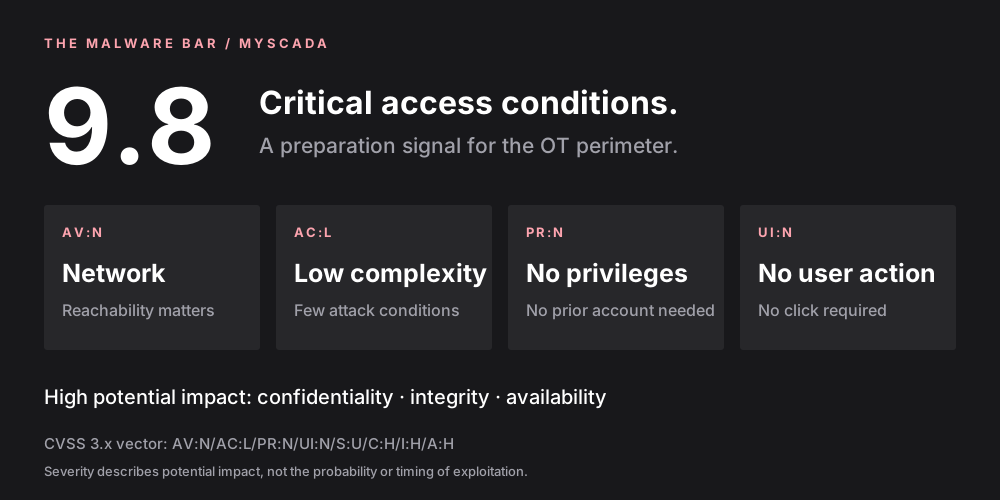
Two mySCADA pre-disclosure signals score 9.8. They put access risk on the agenda; this article examines a separate threat hypothesis: small models cooperating across industrial devices, or capable nodes hosting parts of a larger model. The LOGFORCE LFS Model Family brings a signal-based, non-autoregressive perspective to the timing, relationships and behavioral convergence defenders need to investigate.
mySCADA 9.8: Small Models. One Larger Threat?
MB
LOGFORCE Malware Bar Editorial Board
Predictive Intelligence Analysis Unit
A small model on one industrial device looks like a small problem. But what if the device is only one participant? What if cameras, gateways and industrial computers begin sharing work, responding to one another and coordinating their next move?
The threat is no longer just inside a device. It may emerge between devices. That is the question behind this mySCADA 9.8 spotlight—and the reason to examine the LOGFORCE LFS Model Family through its defining characteristics: signal-based learning and a non-autoregressive architecture.
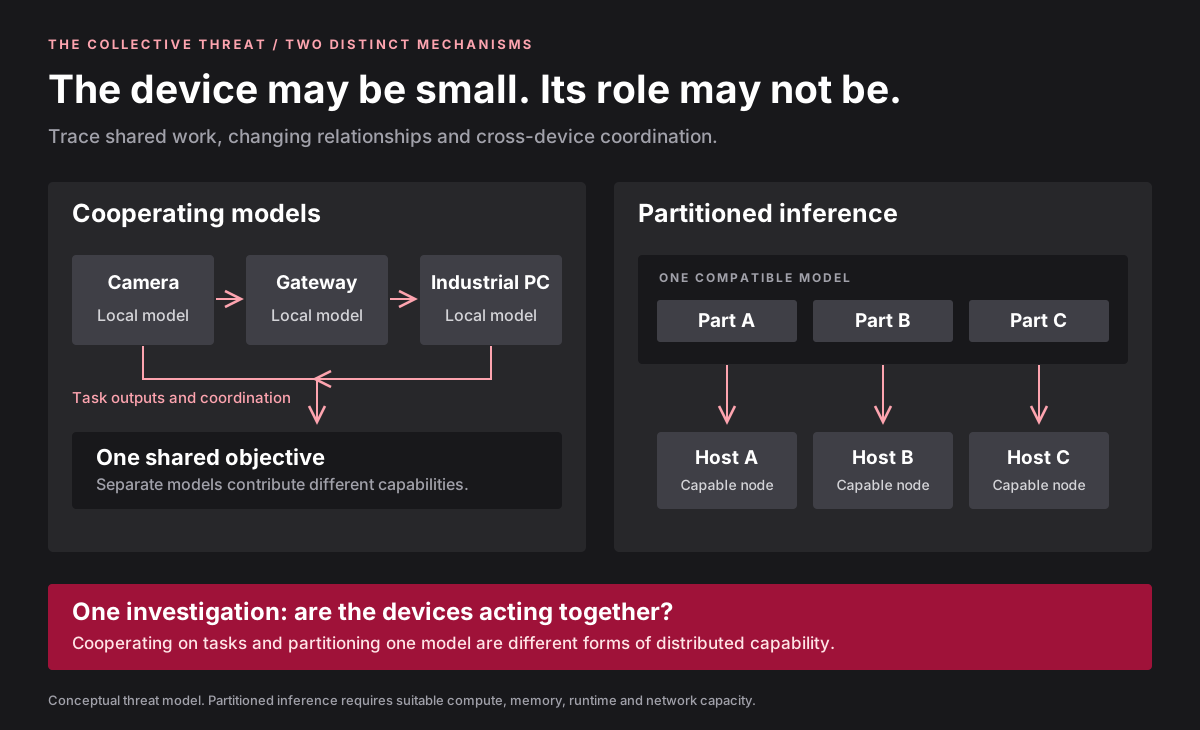
Two ways capability can become distributed. Conceptual threat model, not an observed mySCADA attack. Open the diagram for a larger view.
A vulnerability opens a door. What happens after it opens?
The two current mySCADA pre-disclosure records carry a 9.8 severity score, with network access, low complexity, no prerequisite privileges and no user interaction. They make exposure a concrete priority. They do not establish that an AI model is involved in exploitation.
The forward-looking security question starts there: if an attacker obtains execution on suitable industrial compute, could that foothold become part of a coordinated intelligence workload? A gateway might process local observations. An industrial PC might perform another task. An AI-capable appliance might exchange outputs with both. What matters is whether those activities form an unauthorized, shared workflow.
This is a threat hypothesis to investigate, not a claim that the two mySCADA vulnerabilities have already produced such a system. The affected components and versions remain undisclosed in the records used for this edition.
Small models can cooperate. Larger models can be distributed.
There are two different mechanisms—and confusing them makes the risk harder to understand.
01 / COOPERATING MODELS
Different tasks. Shared objective.
Separate small models exchange results or divide a workflow. Their combined operational reach can exceed what any one participant can achieve alone.
02 / PARTITIONED INFERENCE
One model. Multiple capable hosts.
Compatible nodes execute different parts of the same larger model. This requires suitable hardware, model partitions, runtime support and communication capacity.
Neither mechanism requires every participant to host a complete frontier model. Equally, unrelated small models do not automatically combine their parameters into a larger one. The useful distinction is collaboration between models versus distributed execution of a model.
Collaborative IoT inference and partitioned inference across heterogeneous devices are documented engineering approaches. Their use for an unauthorized industrial workload is the adversarial scenario considered here—not a finding established by those research projects. See the IoT collaboration research and heterogeneous edge-inference research.
Learn the coordination. Not just the conversation.
Explaining a log and learning the dynamics of a device network are different jobs. A fluent account of an incident does not, by itself, establish how the participating systems are behaving together.
LOGFORCE LFS Model Family
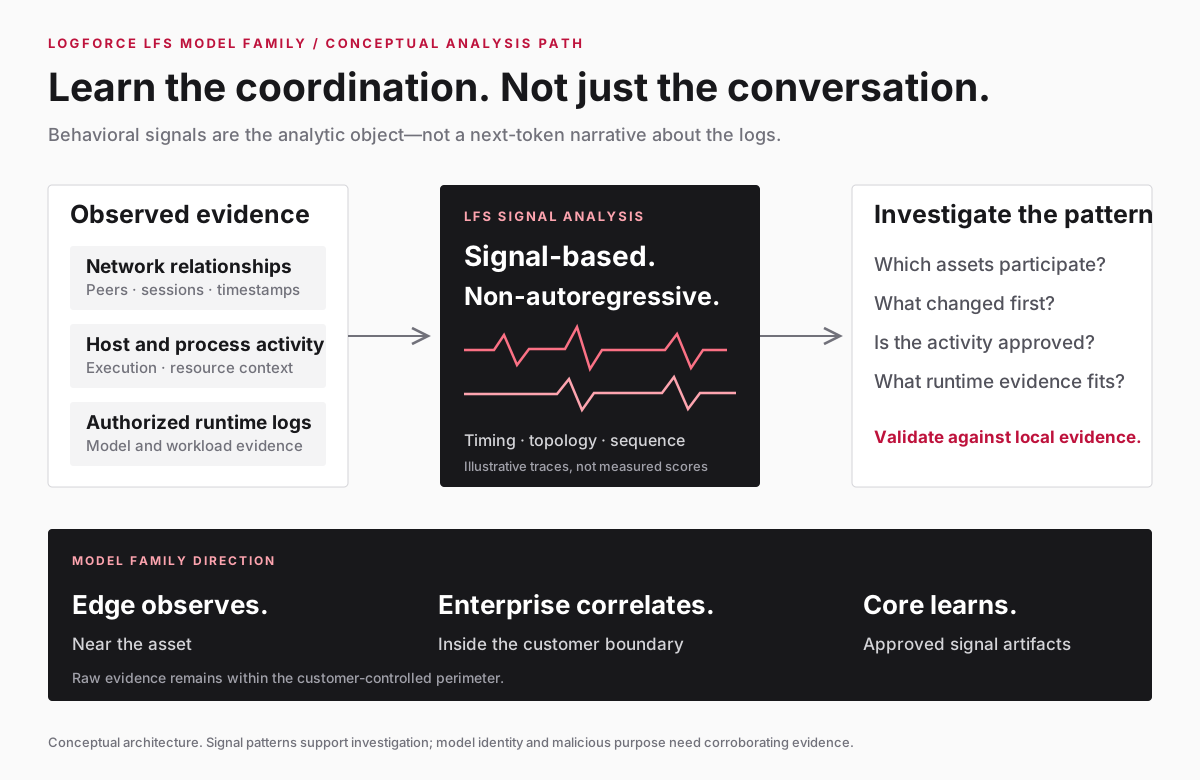
Signal-based. Non-autoregressive. The LFS approach is built around LOGFORCE’s patented signal-learning technology: modeling behavioral signals and their evolution, rather than making next-token text generation the detection mechanism.
For this threat model, the relevant material is the changing structure of activity: timing, sequences, peer relationships, recurrence and convergence across authorized observations. The question is whether individually modest events begin to form a coordinated pattern around a common objective.
The analytic target is cross-device behavioral coherence: how observations on one asset relate to what happens next on another. Investigators can then connect that pattern to the operating process, the approved AI inventory and the local evidence that explains the workload.
Conceptual LFS analysis path. The signal traces illustrate the question being investigated; they are not measured detection results or a model fingerprint. Open the diagram for a larger view.
What would a coordinated workload leave behind?
A distributed workload has operational dependencies even when its application traffic is encrypted. Defenders can examine those dependencies without inventing the contents of the traffic:
Changing peer relationships: new east–west connections or repeated exchanges between assets that do not normally collaborate.
Cross-device timing: recurring request, response and resource-activity patterns associated with the same operational window.
Execution context: unexpected services, processes, model artifacts or runtime activity on hosts capable of running them.
Shared progression: a sequence of access, execution and communication changes that follows the same participating assets.
These observations are investigation leads. Industrial processes are naturally synchronized; approved edge analytics, backups and maintenance can also create coordinated bursts. Baseline against the actual process, maintenance schedule and authorized AI inventory—not a generic assumption that correlated traffic is hostile.
Preserve synchronized timestamps, asset identities, source and destination, action and outcome. Where available, connect network observations to local runtime records, model manifests and process ancestry. Network timing alone cannot establish which model is running or whether its purpose is malicious.
The documented LFS model-family direction separates three roles: observation near the asset, correlation inside the enterprise boundary, and learning from approved signal artifacts and confirmed trajectories. Raw operational evidence stays within the customer-controlled boundary; any shared learning follows the organization’s participation and authorization policy.
Applied to the scenario in this article, that means asking a network-level question while retaining an asset-level evidence trail. Which devices participated? What changed first? Which independent observations support coordination? What evidence distinguishes an AI workload from another distributed process?
The distinctive proposition is signal-native analysis of collective behavior: moving from isolated events to a testable account of how assets relate over time. The result to seek is an evidence-backed coordination finding that SOC and OT teams can inspect together.
The vulnerability score establishes severity and access conditions. It does not attribute exploitation to AI or prove cross-device coordination.
Reported to vendor09 Oct 2026Source metadata
Forecast trigger peak24 Nov 2026LOGFORCE model output
Disclosure deadline06 Feb 2027Coordination timetable
LOGFORCE first ingested these two records in the 15 October 2026 edition. The reported date is the feed’s “Inferred Date”; it is not an earlier LOGFORCE observation. Both signals remain pre-disclosure with confirmation pending. The forecast is a prioritization output, not an announced attack date.
The complete edition contains 866 records, including both mySCADA signals. The Structured Intelligence Feed below remains a separate operational reference; its rules do not constitute a validated detector of the hypothetical model mesh discussed here.
The vulnerability is local. The behavior may be collective.
MoC Signal Severity Distribution (records)Counts the current LOGFORCE intelligence set by CVSS severity band. One unit equals one ranked record; it shows signal concentration, not confirmed exploitation.
Top Vendor Exposure (MoC records)Counts ranked LOGFORCE records assigned to each vendor family in the current issue. One unit equals one intelligence record.
Signal Velocity: 2026 Corroborated Cohort Through Time (same records/month)This graph follows one fixed 2026 cohort: only LOGFORCE records inferred in 2026 that later received normalized vendor and temporal-window corroboration. Red is the month of inference, rose is the forecast peak assigned before confirmation, and white is the month independent evidence arrived. Every line counts the same records; no secondary scale or normalization is used.
Structured Intelligence Feed
Top 10 Machine-readable predictive data stream
Vendor
Inferred Date
Forecasted Trigger Peak
Estimated Severity
mySCADA
2026-10-09
2026-11-24
CRITICAL (9.8)
STIX 2.1 Alert
mySCADA is ranked for a network-exposed surface with CVSS 9.8. The declared path is low-complexity network access, no prior privileges and no user interaction and may affect high confidentiality, high integrity, high availability.
The projected trigger peak is 2026-11-24.
No direct confirmed vendor-family baseline is present in the current catalog; this record remains predictive.
Prioritize monitoring of mySCADA-associated assets for remote requests, authentication changes, service errors and server-side child processes. Give higher priority to correlated observations across network, web, identity, endpoint telemetry, particularly when an initial access condition is followed by an unexpected process, identity, configuration, file or outbound-network change.
Treat this alert as an evidence-gathering and detection-readiness signal. The forecast indicates elevated exposure priority and does not, by itself, constitute evidence of active exploitation or compromise.
Most Recent Criticality SIGMA Logic
title: Observe mySCADA network criticality conditions
id: 86a022ec-184e-4125-bf5d-1b09b63a9e00
status: experimental
description: No direct vendor-family confirmation baseline is present in the current confirmed-exploitation catalog. Observes the current mySCADA network exposed surface criticality class through network, web, identity, endpoint telemetry, prioritizing remote requests, authentication changes, service errors and server-side child processes.
author: logforce.com
date: 2026/10/15
logsource:
  category: generic
  product: generic
detection:
  selection_network:
    destination.port|exists: true
    network.direction: inbound
  selection_web:
    http.request.method:
      - POST
      - PUT
      - DELETE
    http.response.status_code:
      - 400
      - 401
      - 403
      - 500
  selection_process:
    process.parent.name|exists: true
    process.name|endswith:
      - '\cmd.exe'
      - '\powershell.exe'
      - '/sh'
      - '/bash'
  condition: 1 of selection_*
falsepositives:
  - Approved administration, deployment, maintenance or incident-response activity
level: critical
Experimental Predictive SIGMA Logic
title: Predictive telemetry correlation for mySCADA network surface
id: 3ec30000-f023-4a24-9e96-63c422e6fabf
status: experimental
description: Correlates anomalous mySCADA network exposed surface activity across network, web, identity, endpoint telemetry during the observation window from 2026-10-09 through 2027-02-06. It requires multiple related observations around remote requests, authentication changes, service errors and server-side child processes before raising severity for activity consistent with the declared low-complexity network access, no prior privileges and no user interaction path and potential high confidentiality, high integrity, high availability impact.
author: logforce.com
date: 2026/10/15
logsource:
  category: generic
  product: generic
detection:
  selection_network:
    destination.port|exists: true
    network.direction: inbound
  selection_web:
    http.request.method:
      - POST
      - PUT
      - DELETE
    http.response.status_code:
      - 400
      - 401
      - 403
      - 500
  selection_process:
    process.parent.name|exists: true
    process.name|endswith:
      - '\cmd.exe'
      - '\powershell.exe'
      - '/sh'
      - '/bash'
  condition: 2 of selection_*
falsepositives:
  - Approved administration, deployment, maintenance or incident-response activity
level: high
Deployment Queries
SPL:
index=security (event_category=network OR event_category=web OR event_category=authentication OR event_category=process) | eval entity=coalesce(dest,host,user,src), action=coalesce(http_method,action,process_name), result=coalesce(status,http_status) | bucket _time span=5m | stats count dc(src) as sources dc(action) as actions values(result) as results by _time entity | eventstats avg(count) as baseline stdev(count) as deviation by entity | where count > baseline + (2*deviation)

EDR normalized:
(event.category == "process" AND process.parent.name != null AND process.name IN ("cmd.exe","powershell.exe","sh","bash")) OR (event.category == "network" AND network.direction == "inbound")

XDR normalized:
(event.category:process AND process.parent.name:* AND process.name:(cmd.exe OR powershell.exe OR sh OR bash)) OR (event.category:network AND network.direction:inbound)
OBJECTIVE
Detect and prioritize behavioral evidence consistent with suspicious activity targeting a network exposed surface associated with mySCADA.

IMPORTANT ANALYTIC CONSTRAINT
This detection is predictive and evidence-gathering oriented. Do NOT assume that exploitation is occurring.

No specific vulnerability identifier is established by this forecast. Do NOT invent or infer a CVE from vendor identity, severity, exposure or observed errors.

THREAT MODEL
Prioritize activity compatible with:

remote network access;
no prior authentication or privileges required;
no user interaction;
low attack complexity;
potential high confidentiality, high integrity, high availability impact.

TARGET SCOPE
Prioritize mySCADA infrastructure and systems associated with mySCADA services, management interfaces, appliances, gateways, application endpoints or other network-exposed components.

TELEMETRY TO CORRELATE
Analyze available:

network telemetry;
web telemetry;
identity telemetry;
endpoint telemetry;
service and application errors;
asset exposure and role context.

PRIMARY OBSERVATIONS

NETWORK
Identify inbound connections, especially unusual sources, bursts, increasing frequency, source-diversity changes, uncommon ports and repeated access against the same asset.

WEB
Identify suspicious POST, PUT or DELETE activity correlated with HTTP 400, 401, 403 or 500 responses, malformed requests, unusual paths, unusual parameters or multiple failures followed by behavioral change.

PROCESS EXECUTION
Prioritize a network-facing service temporally associated with child execution of cmd.exe, powershell.exe, sh, bash or another rare shell or interpreter. Increase severity when the parent is normally non-interactive.

IDENTITY
Look for authentication-state changes, unusual account creation, privilege changes, activity without a corresponding legitimate login and authentication behavior inconsistent with the preceding baseline.

CORRELATION
Use a rolling 5-minute window.

Create an elevated detection when at least TWO independent telemetry classes converge around the same target asset, identity, service or execution chain.

Give substantially greater weight to a plausible ordered sequence than to isolated exposure, scanning, errors or administrative activity.

BASELINE / ANOMALY ANALYSIS
For each target entity, compare current behavior against its historical baseline.

Consider:

event volume;
distinct source count;
distinct actions;
error or denial rate;
process rarity and parent-child rarity;
identity, privilege, file or configuration changes.

Treat activity satisfying:

current_count > baseline_mean + 2 * baseline_standard_deviation

as supporting anomaly evidence, not standalone proof of compromise.

SCORING

LOW:
Only expected exposure or one weak, isolated observation is present.

MEDIUM:
Activity is anomalous relative to the asset or identity baseline.

HIGH:
Two independent telemetry classes converge within the correlation window.

CRITICAL:
Suspicious initial activity is followed by unusual process execution, privilege modification, persistence, sensitive file change, configuration change or outbound activity.

FALSE-POSITIVE CONTROL
Before escalating, evaluate whether the activity can reasonably be explained by:

approved administration;
deployment;
vulnerability scanning;
monitoring;
maintenance;
incident-response activity;
known automation;
authorized security testing.

Do not suppress solely because one event resembles legitimate administration. Evaluate temporal sequence, source context, asset role, rarity and cross-telemetry correlation.

REASONING REQUIREMENT
Distinguish explicitly between:

EXPOSURE
The asset or execution surface is reachable, present or available.

SUSPICIOUS ACTIVITY
The surface is receiving anomalous requests, access attempts, inputs or state changes.

POST-ACCESS EVIDENCE
Endpoint, process, identity, file, configuration or outbound-network telemetry indicates that the suspicious activity may have produced an effect.

Never classify EXPOSURE alone as successful exploitation.

OUTPUT
Return:

{
  "verdict": "BENIGN | EXPOSURE | SUSPICIOUS_ACTIVITY | POSSIBLE_EXPLOITATION | HIGH_CONFIDENCE_COMPROMISE",
  "confidence": 0-100,
  "severity": "LOW | MEDIUM | HIGH | CRITICAL",
  "target_asset": "",
  "time_window": "",
  "observed_signals": [],
  "correlated_signals": [],
  "anomalies": [],
  "process_chain": [],
  "network_sources": [],
  "identity_changes": [],
  "legitimate_explanations": [],
  "evidence_for": [],
  "evidence_against": [],
  "recommended_investigation": [],
  "reasoning_summary": ""
}

DECISION POLICY
Prefer evidence over prediction.

Do not claim exploitation from vulnerability severity, vendor history, forecast dates, exposure, errors or anomaly scores alone.

Escalate toward POSSIBLE_EXPLOITATION only when telemetry supports a plausible causal sequence such as:

external inbound request
-> mySCADA-associated network-facing service
-> anomalous response or service behavior
-> unexpected child process, identity change, persistence or outbound activity

Escalate toward HIGH_CONFIDENCE_COMPROMISE only when multiple independent post-access signals corroborate the sequence.
MindsDB
2026-10-07
2026-11-22
CRITICAL (9.8)
STIX 2.1 Alert
MindsDB is ranked for a network-exposed surface with CVSS 9.8. The declared path is low-complexity network access, no prior privileges and no user interaction and may affect high confidentiality, high integrity, high availability.
The projected trigger peak is 2026-11-22.
No direct confirmed vendor-family baseline is present in the current catalog; this record remains predictive.
Prioritize monitoring of MindsDB-associated assets for remote requests, authentication changes, service errors and server-side child processes. Give higher priority to correlated observations across network, web, identity, endpoint telemetry, particularly when an initial access condition is followed by an unexpected process, identity, configuration, file or outbound-network change.
Treat this alert as an evidence-gathering and detection-readiness signal. The forecast indicates elevated exposure priority and does not, by itself, constitute evidence of active exploitation or compromise.
Most Recent Criticality SIGMA Logic
title: Observe MindsDB network criticality conditions
id: 7e5c176d-b390-4b24-8f19-8889ff5fa63d
status: experimental
description: No direct vendor-family confirmation baseline is present in the current confirmed-exploitation catalog. Observes the current MindsDB network exposed surface criticality class through network, web, identity, endpoint telemetry, prioritizing remote requests, authentication changes, service errors and server-side child processes.
author: logforce.com
date: 2026/10/15
logsource:
  category: generic
  product: generic
detection:
  selection_network:
    destination.port|exists: true
    network.direction: inbound
  selection_web:
    http.request.method:
      - POST
      - PUT
      - DELETE
    http.response.status_code:
      - 400
      - 401
      - 403
      - 500
  selection_process:
    process.parent.name|exists: true
    process.name|endswith:
      - '\cmd.exe'
      - '\powershell.exe'
      - '/sh'
      - '/bash'
  condition: 1 of selection_*
falsepositives:
  - Approved administration, deployment, maintenance or incident-response activity
level: critical
Experimental Predictive SIGMA Logic
title: Predictive telemetry correlation for MindsDB network surface
id: 90e54d5f-5a00-40aa-8b12-6ec9a2578f8e
status: experimental
description: Correlates anomalous MindsDB network exposed surface activity across network, web, identity, endpoint telemetry during the observation window from 2026-10-07 through 2027-02-04. It requires multiple related observations around remote requests, authentication changes, service errors and server-side child processes before raising severity for activity consistent with the declared low-complexity network access, no prior privileges and no user interaction path and potential high confidentiality, high integrity, high availability impact.
author: logforce.com
date: 2026/10/15
logsource:
  category: generic
  product: generic
detection:
  selection_network:
    destination.port|exists: true
    network.direction: inbound
  selection_web:
    http.request.method:
      - POST
      - PUT
      - DELETE
    http.response.status_code:
      - 400
      - 401
      - 403
      - 500
  selection_process:
    process.parent.name|exists: true
    process.name|endswith:
      - '\cmd.exe'
      - '\powershell.exe'
      - '/sh'
      - '/bash'
  condition: 2 of selection_*
falsepositives:
  - Approved administration, deployment, maintenance or incident-response activity
level: high
Deployment Queries
SPL:
index=security (event_category=network OR event_category=web OR event_category=authentication OR event_category=process) | eval entity=coalesce(dest,host,user,src), action=coalesce(http_method,action,process_name), result=coalesce(status,http_status) | bucket _time span=5m | stats count dc(src) as sources dc(action) as actions values(result) as results by _time entity | eventstats avg(count) as baseline stdev(count) as deviation by entity | where count > baseline + (2*deviation)

EDR normalized:
(event.category == "process" AND process.parent.name != null AND process.name IN ("cmd.exe","powershell.exe","sh","bash")) OR (event.category == "network" AND network.direction == "inbound")

XDR normalized:
(event.category:process AND process.parent.name:* AND process.name:(cmd.exe OR powershell.exe OR sh OR bash)) OR (event.category:network AND network.direction:inbound)
OBJECTIVE
Detect and prioritize behavioral evidence consistent with suspicious activity targeting a network exposed surface associated with MindsDB.

IMPORTANT ANALYTIC CONSTRAINT
This detection is predictive and evidence-gathering oriented. Do NOT assume that exploitation is occurring.

No specific vulnerability identifier is established by this forecast. Do NOT invent or infer a CVE from vendor identity, severity, exposure or observed errors.

THREAT MODEL
Prioritize activity compatible with:

remote network access;
no prior authentication or privileges required;
no user interaction;
low attack complexity;
potential high confidentiality, high integrity, high availability impact.

TARGET SCOPE
Prioritize MindsDB infrastructure and systems associated with MindsDB services, management interfaces, appliances, gateways, application endpoints or other network-exposed components.

TELEMETRY TO CORRELATE
Analyze available:

network telemetry;
web telemetry;
identity telemetry;
endpoint telemetry;
service and application errors;
asset exposure and role context.

PRIMARY OBSERVATIONS

NETWORK
Identify inbound connections, especially unusual sources, bursts, increasing frequency, source-diversity changes, uncommon ports and repeated access against the same asset.

WEB
Identify suspicious POST, PUT or DELETE activity correlated with HTTP 400, 401, 403 or 500 responses, malformed requests, unusual paths, unusual parameters or multiple failures followed by behavioral change.

PROCESS EXECUTION
Prioritize a network-facing service temporally associated with child execution of cmd.exe, powershell.exe, sh, bash or another rare shell or interpreter. Increase severity when the parent is normally non-interactive.

IDENTITY
Look for authentication-state changes, unusual account creation, privilege changes, activity without a corresponding legitimate login and authentication behavior inconsistent with the preceding baseline.

CORRELATION
Use a rolling 5-minute window.

Create an elevated detection when at least TWO independent telemetry classes converge around the same target asset, identity, service or execution chain.

Give substantially greater weight to a plausible ordered sequence than to isolated exposure, scanning, errors or administrative activity.

BASELINE / ANOMALY ANALYSIS
For each target entity, compare current behavior against its historical baseline.

Consider:

event volume;
distinct source count;
distinct actions;
error or denial rate;
process rarity and parent-child rarity;
identity, privilege, file or configuration changes.

Treat activity satisfying:

current_count > baseline_mean + 2 * baseline_standard_deviation

as supporting anomaly evidence, not standalone proof of compromise.

SCORING

LOW:
Only expected exposure or one weak, isolated observation is present.

MEDIUM:
Activity is anomalous relative to the asset or identity baseline.

HIGH:
Two independent telemetry classes converge within the correlation window.

CRITICAL:
Suspicious initial activity is followed by unusual process execution, privilege modification, persistence, sensitive file change, configuration change or outbound activity.

FALSE-POSITIVE CONTROL
Before escalating, evaluate whether the activity can reasonably be explained by:

approved administration;
deployment;
vulnerability scanning;
monitoring;
maintenance;
incident-response activity;
known automation;
authorized security testing.

Do not suppress solely because one event resembles legitimate administration. Evaluate temporal sequence, source context, asset role, rarity and cross-telemetry correlation.

REASONING REQUIREMENT
Distinguish explicitly between:

EXPOSURE
The asset or execution surface is reachable, present or available.

SUSPICIOUS ACTIVITY
The surface is receiving anomalous requests, access attempts, inputs or state changes.

POST-ACCESS EVIDENCE
Endpoint, process, identity, file, configuration or outbound-network telemetry indicates that the suspicious activity may have produced an effect.

Never classify EXPOSURE alone as successful exploitation.

OUTPUT
Return:

{
  "verdict": "BENIGN | EXPOSURE | SUSPICIOUS_ACTIVITY | POSSIBLE_EXPLOITATION | HIGH_CONFIDENCE_COMPROMISE",
  "confidence": 0-100,
  "severity": "LOW | MEDIUM | HIGH | CRITICAL",
  "target_asset": "",
  "time_window": "",
  "observed_signals": [],
  "correlated_signals": [],
  "anomalies": [],
  "process_chain": [],
  "network_sources": [],
  "identity_changes": [],
  "legitimate_explanations": [],
  "evidence_for": [],
  "evidence_against": [],
  "recommended_investigation": [],
  "reasoning_summary": ""
}

DECISION POLICY
Prefer evidence over prediction.

Do not claim exploitation from vulnerability severity, vendor history, forecast dates, exposure, errors or anomaly scores alone.

Escalate toward POSSIBLE_EXPLOITATION only when telemetry supports a plausible causal sequence such as:

external inbound request
-> MindsDB-associated network-facing service
-> anomalous response or service behavior
-> unexpected child process, identity change, persistence or outbound activity

Escalate toward HIGH_CONFIDENCE_COMPROMISE only when multiple independent post-access signals corroborate the sequence.
Cisco
2026-10-01
2026-11-04
CRITICAL (9.8)
STIX 2.1 Alert
Cisco is ranked for a network-exposed surface with CVSS 9.8. The declared path is low-complexity network access, no prior privileges and no user interaction and may affect high confidentiality, high integrity, high availability.
The projected trigger peak is 2026-11-04.
The vendor-family baseline contains 101 confirmed exploited-vulnerability records; the most recent is CVE-2026-76519, added 2026-10-14. This is calibration context, not an exact vulnerability match.
Prioritize monitoring of Cisco-associated assets for remote requests, authentication changes, service errors and server-side child processes. Give higher priority to correlated observations across network, web, identity, endpoint telemetry, particularly when an initial access condition is followed by an unexpected process, identity, configuration, file or outbound-network change.
Treat this alert as an evidence-gathering and detection-readiness signal. The forecast indicates elevated exposure priority and does not, by itself, constitute evidence of active exploitation or compromise.
Most Recent Criticality SIGMA Logic
title: Observe Cisco network criticality conditions
id: cb7a1a65-ede8-45b2-9a82-28024664c9c3
status: experimental
description: The vendor-family confirmation baseline is anchored by CVE-2026-76519, added 2026-10-14; this context does not equate that record with the present forecast. Observes the current Cisco network exposed surface criticality class through network, web, identity, endpoint telemetry, prioritizing remote requests, authentication changes, service errors and server-side child processes.
author: logforce.com
date: 2026/10/15
logsource:
  category: generic
  product: generic
detection:
  selection_network:
    destination.port|exists: true
    network.direction: inbound
  selection_web:
    http.request.method:
      - POST
      - PUT
      - DELETE
    http.response.status_code:
      - 400
      - 401
      - 403
      - 500
  selection_process:
    process.parent.name|exists: true
    process.name|endswith:
      - '\cmd.exe'
      - '\powershell.exe'
      - '/sh'
      - '/bash'
  condition: 1 of selection_*
falsepositives:
  - Approved administration, deployment, maintenance or incident-response activity
level: critical
Experimental Predictive SIGMA Logic
title: Predictive telemetry correlation for Cisco network surface
id: 0798caf9-c11c-47b1-921d-0e90863b74b1
status: experimental
description: Correlates anomalous Cisco network exposed surface activity across network, web, identity, endpoint telemetry during the observation window from 2026-10-01 through 2027-01-29. It requires multiple related observations around remote requests, authentication changes, service errors and server-side child processes before raising severity for activity consistent with the declared low-complexity network access, no prior privileges and no user interaction path and potential high confidentiality, high integrity, high availability impact.
author: logforce.com
date: 2026/10/15
logsource:
  category: generic
  product: generic
detection:
  selection_network:
    destination.port|exists: true
    network.direction: inbound
  selection_web:
    http.request.method:
      - POST
      - PUT
      - DELETE
    http.response.status_code:
      - 400
      - 401
      - 403
      - 500
  selection_process:
    process.parent.name|exists: true
    process.name|endswith:
      - '\cmd.exe'
      - '\powershell.exe'
      - '/sh'
      - '/bash'
  condition: 2 of selection_*
falsepositives:
  - Approved administration, deployment, maintenance or incident-response activity
level: high
Deployment Queries
SPL:
index=security (event_category=network OR event_category=web OR event_category=authentication OR event_category=process) | eval entity=coalesce(dest,host,user,src), action=coalesce(http_method,action,process_name), result=coalesce(status,http_status) | bucket _time span=5m | stats count dc(src) as sources dc(action) as actions values(result) as results by _time entity | eventstats avg(count) as baseline stdev(count) as deviation by entity | where count > baseline + (2*deviation)

EDR normalized:
(event.category == "process" AND process.parent.name != null AND process.name IN ("cmd.exe","powershell.exe","sh","bash")) OR (event.category == "network" AND network.direction == "inbound")

XDR normalized:
(event.category:process AND process.parent.name:* AND process.name:(cmd.exe OR powershell.exe OR sh OR bash)) OR (event.category:network AND network.direction:inbound)
OBJECTIVE
Detect and prioritize behavioral evidence consistent with suspicious activity targeting a network exposed surface associated with Cisco.

IMPORTANT ANALYTIC CONSTRAINT
This detection is predictive and evidence-gathering oriented. Do NOT assume that exploitation is occurring.

Do NOT attribute activity to CVE-2026-76519 or any other specific vulnerability unless independent telemetry provides sufficient evidence.

CVE-2026-76519 is vendor-family historical calibration context only.

THREAT MODEL
Prioritize activity compatible with:

remote network access;
no prior authentication or privileges required;
no user interaction;
low attack complexity;
potential high confidentiality, high integrity, high availability impact.

TARGET SCOPE
Prioritize Cisco infrastructure and systems associated with Cisco services, management interfaces, appliances, gateways, application endpoints or other network-exposed components.

TELEMETRY TO CORRELATE
Analyze available:

network telemetry;
web telemetry;
identity telemetry;
endpoint telemetry;
service and application errors;
asset exposure and role context.

PRIMARY OBSERVATIONS

NETWORK
Identify inbound connections, especially unusual sources, bursts, increasing frequency, source-diversity changes, uncommon ports and repeated access against the same asset.

WEB
Identify suspicious POST, PUT or DELETE activity correlated with HTTP 400, 401, 403 or 500 responses, malformed requests, unusual paths, unusual parameters or multiple failures followed by behavioral change.

PROCESS EXECUTION
Prioritize a network-facing service temporally associated with child execution of cmd.exe, powershell.exe, sh, bash or another rare shell or interpreter. Increase severity when the parent is normally non-interactive.

IDENTITY
Look for authentication-state changes, unusual account creation, privilege changes, activity without a corresponding legitimate login and authentication behavior inconsistent with the preceding baseline.

CORRELATION
Use a rolling 5-minute window.

Create an elevated detection when at least TWO independent telemetry classes converge around the same target asset, identity, service or execution chain.

Give substantially greater weight to a plausible ordered sequence than to isolated exposure, scanning, errors or administrative activity.

BASELINE / ANOMALY ANALYSIS
For each target entity, compare current behavior against its historical baseline.

Consider:

event volume;
distinct source count;
distinct actions;
error or denial rate;
process rarity and parent-child rarity;
identity, privilege, file or configuration changes.

Treat activity satisfying:

current_count > baseline_mean + 2 * baseline_standard_deviation

as supporting anomaly evidence, not standalone proof of compromise.

SCORING

LOW:
Only expected exposure or one weak, isolated observation is present.

MEDIUM:
Activity is anomalous relative to the asset or identity baseline.

HIGH:
Two independent telemetry classes converge within the correlation window.

CRITICAL:
Suspicious initial activity is followed by unusual process execution, privilege modification, persistence, sensitive file change, configuration change or outbound activity.

FALSE-POSITIVE CONTROL
Before escalating, evaluate whether the activity can reasonably be explained by:

approved administration;
deployment;
vulnerability scanning;
monitoring;
maintenance;
incident-response activity;
known automation;
authorized security testing.

Do not suppress solely because one event resembles legitimate administration. Evaluate temporal sequence, source context, asset role, rarity and cross-telemetry correlation.

REASONING REQUIREMENT
Distinguish explicitly between:

EXPOSURE
The asset or execution surface is reachable, present or available.

SUSPICIOUS ACTIVITY
The surface is receiving anomalous requests, access attempts, inputs or state changes.

POST-ACCESS EVIDENCE
Endpoint, process, identity, file, configuration or outbound-network telemetry indicates that the suspicious activity may have produced an effect.

Never classify EXPOSURE alone as successful exploitation.

OUTPUT
Return:

{
  "verdict": "BENIGN | EXPOSURE | SUSPICIOUS_ACTIVITY | POSSIBLE_EXPLOITATION | HIGH_CONFIDENCE_COMPROMISE",
  "confidence": 0-100,
  "severity": "LOW | MEDIUM | HIGH | CRITICAL",
  "target_asset": "",
  "time_window": "",
  "observed_signals": [],
  "correlated_signals": [],
  "anomalies": [],
  "process_chain": [],
  "network_sources": [],
  "identity_changes": [],
  "legitimate_explanations": [],
  "evidence_for": [],
  "evidence_against": [],
  "recommended_investigation": [],
  "reasoning_summary": ""
}

DECISION POLICY
Prefer evidence over prediction.

Do not claim exploitation from vulnerability severity, vendor history, forecast dates, exposure, errors or anomaly scores alone.

Escalate toward POSSIBLE_EXPLOITATION only when telemetry supports a plausible causal sequence such as:

external inbound request
-> Cisco-associated network-facing service
-> anomalous response or service behavior
-> unexpected child process, identity change, persistence or outbound activity

Escalate toward HIGH_CONFIDENCE_COMPROMISE only when multiple independent post-access signals corroborate the sequence.
LG
2026-09-24
2026-11-09
CRITICAL (9.8)
STIX 2.1 Alert
LG is ranked for a network-exposed surface with CVSS 9.8. The declared path is low-complexity network access, no prior privileges and no user interaction and may affect high confidentiality, high integrity, high availability.
The projected trigger peak is 2026-11-09.
The vendor-family baseline contains 1 confirmed exploited-vulnerability record; the most recent is CVE-2018-14839, added 2022-03-25. This is calibration context, not an exact vulnerability match.
Prioritize monitoring of LG-associated assets for remote requests, authentication changes, service errors and server-side child processes. Give higher priority to correlated observations across network, web, identity, endpoint telemetry, particularly when an initial access condition is followed by an unexpected process, identity, configuration, file or outbound-network change.
Treat this alert as an evidence-gathering and detection-readiness signal. The forecast indicates elevated exposure priority and does not, by itself, constitute evidence of active exploitation or compromise.
Most Recent Criticality SIGMA Logic
title: Observe LG network criticality conditions
id: ffb25896-33e0-4e90-862c-391fc3090238
status: experimental
description: The vendor-family confirmation baseline is anchored by CVE-2018-14839, added 2022-03-25; this context does not equate that record with the present forecast. Observes the current LG network exposed surface criticality class through network, web, identity, endpoint telemetry, prioritizing remote requests, authentication changes, service errors and server-side child processes.
author: logforce.com
date: 2026/10/15
logsource:
  category: generic
  product: generic
detection:
  selection_network:
    destination.port|exists: true
    network.direction: inbound
  selection_web:
    http.request.method:
      - POST
      - PUT
      - DELETE
    http.response.status_code:
      - 400
      - 401
      - 403
      - 500
  selection_process:
    process.parent.name|exists: true
    process.name|endswith:
      - '\cmd.exe'
      - '\powershell.exe'
      - '/sh'
      - '/bash'
  condition: 1 of selection_*
falsepositives:
  - Approved administration, deployment, maintenance or incident-response activity
level: critical
Experimental Predictive SIGMA Logic
title: Predictive telemetry correlation for LG network surface
id: accd909e-7f27-4379-bccd-7cfd919997de
status: experimental
description: Correlates anomalous LG network exposed surface activity across network, web, identity, endpoint telemetry during the observation window from 2026-09-24 through 2027-01-22. It requires multiple related observations around remote requests, authentication changes, service errors and server-side child processes before raising severity for activity consistent with the declared low-complexity network access, no prior privileges and no user interaction path and potential high confidentiality, high integrity, high availability impact.
author: logforce.com
date: 2026/10/15
logsource:
  category: generic
  product: generic
detection:
  selection_network:
    destination.port|exists: true
    network.direction: inbound
  selection_web:
    http.request.method:
      - POST
      - PUT
      - DELETE
    http.response.status_code:
      - 400
      - 401
      - 403
      - 500
  selection_process:
    process.parent.name|exists: true
    process.name|endswith:
      - '\cmd.exe'
      - '\powershell.exe'
      - '/sh'
      - '/bash'
  condition: 2 of selection_*
falsepositives:
  - Approved administration, deployment, maintenance or incident-response activity
level: high
Deployment Queries
SPL:
index=security (event_category=network OR event_category=web OR event_category=authentication OR event_category=process) | eval entity=coalesce(dest,host,user,src), action=coalesce(http_method,action,process_name), result=coalesce(status,http_status) | bucket _time span=5m | stats count dc(src) as sources dc(action) as actions values(result) as results by _time entity | eventstats avg(count) as baseline stdev(count) as deviation by entity | where count > baseline + (2*deviation)

EDR normalized:
(event.category == "process" AND process.parent.name != null AND process.name IN ("cmd.exe","powershell.exe","sh","bash")) OR (event.category == "network" AND network.direction == "inbound")

XDR normalized:
(event.category:process AND process.parent.name:* AND process.name:(cmd.exe OR powershell.exe OR sh OR bash)) OR (event.category:network AND network.direction:inbound)
OBJECTIVE
Detect and prioritize behavioral evidence consistent with suspicious activity targeting a network exposed surface associated with LG.

IMPORTANT ANALYTIC CONSTRAINT
This detection is predictive and evidence-gathering oriented. Do NOT assume that exploitation is occurring.

Do NOT attribute activity to CVE-2018-14839 or any other specific vulnerability unless independent telemetry provides sufficient evidence.

CVE-2018-14839 is vendor-family historical calibration context only.

THREAT MODEL
Prioritize activity compatible with:

remote network access;
no prior authentication or privileges required;
no user interaction;
low attack complexity;
potential high confidentiality, high integrity, high availability impact.

TARGET SCOPE
Prioritize LG infrastructure and systems associated with LG services, management interfaces, appliances, gateways, application endpoints or other network-exposed components.

TELEMETRY TO CORRELATE
Analyze available:

network telemetry;
web telemetry;
identity telemetry;
endpoint telemetry;
service and application errors;
asset exposure and role context.

PRIMARY OBSERVATIONS

NETWORK
Identify inbound connections, especially unusual sources, bursts, increasing frequency, source-diversity changes, uncommon ports and repeated access against the same asset.

WEB
Identify suspicious POST, PUT or DELETE activity correlated with HTTP 400, 401, 403 or 500 responses, malformed requests, unusual paths, unusual parameters or multiple failures followed by behavioral change.

PROCESS EXECUTION
Prioritize a network-facing service temporally associated with child execution of cmd.exe, powershell.exe, sh, bash or another rare shell or interpreter. Increase severity when the parent is normally non-interactive.

IDENTITY
Look for authentication-state changes, unusual account creation, privilege changes, activity without a corresponding legitimate login and authentication behavior inconsistent with the preceding baseline.

CORRELATION
Use a rolling 5-minute window.

Create an elevated detection when at least TWO independent telemetry classes converge around the same target asset, identity, service or execution chain.

Give substantially greater weight to a plausible ordered sequence than to isolated exposure, scanning, errors or administrative activity.

BASELINE / ANOMALY ANALYSIS
For each target entity, compare current behavior against its historical baseline.

Consider:

event volume;
distinct source count;
distinct actions;
error or denial rate;
process rarity and parent-child rarity;
identity, privilege, file or configuration changes.

Treat activity satisfying:

current_count > baseline_mean + 2 * baseline_standard_deviation

as supporting anomaly evidence, not standalone proof of compromise.

SCORING

LOW:
Only expected exposure or one weak, isolated observation is present.

MEDIUM:
Activity is anomalous relative to the asset or identity baseline.

HIGH:
Two independent telemetry classes converge within the correlation window.

CRITICAL:
Suspicious initial activity is followed by unusual process execution, privilege modification, persistence, sensitive file change, configuration change or outbound activity.

FALSE-POSITIVE CONTROL
Before escalating, evaluate whether the activity can reasonably be explained by:

approved administration;
deployment;
vulnerability scanning;
monitoring;
maintenance;
incident-response activity;
known automation;
authorized security testing.

Do not suppress solely because one event resembles legitimate administration. Evaluate temporal sequence, source context, asset role, rarity and cross-telemetry correlation.

REASONING REQUIREMENT
Distinguish explicitly between:

EXPOSURE
The asset or execution surface is reachable, present or available.

SUSPICIOUS ACTIVITY
The surface is receiving anomalous requests, access attempts, inputs or state changes.

POST-ACCESS EVIDENCE
Endpoint, process, identity, file, configuration or outbound-network telemetry indicates that the suspicious activity may have produced an effect.

Never classify EXPOSURE alone as successful exploitation.

OUTPUT
Return:

{
  "verdict": "BENIGN | EXPOSURE | SUSPICIOUS_ACTIVITY | POSSIBLE_EXPLOITATION | HIGH_CONFIDENCE_COMPROMISE",
  "confidence": 0-100,
  "severity": "LOW | MEDIUM | HIGH | CRITICAL",
  "target_asset": "",
  "time_window": "",
  "observed_signals": [],
  "correlated_signals": [],
  "anomalies": [],
  "process_chain": [],
  "network_sources": [],
  "identity_changes": [],
  "legitimate_explanations": [],
  "evidence_for": [],
  "evidence_against": [],
  "recommended_investigation": [],
  "reasoning_summary": ""
}

DECISION POLICY
Prefer evidence over prediction.

Do not claim exploitation from vulnerability severity, vendor history, forecast dates, exposure, errors or anomaly scores alone.

Escalate toward POSSIBLE_EXPLOITATION only when telemetry supports a plausible causal sequence such as:

external inbound request
-> LG-associated network-facing service
-> anomalous response or service behavior
-> unexpected child process, identity change, persistence or outbound activity

Escalate toward HIGH_CONFIDENCE_COMPROMISE only when multiple independent post-access signals corroborate the sequence.
Linux
2026-09-22
2026-10-31
CRITICAL (9.0)
STIX 2.1 Alert
Linux is ranked for a network-exposed surface with CVSS 9. The declared path is high-complexity network access, no prior privileges and no user interaction and may affect high confidentiality, high integrity, high availability.
The projected trigger peak is 2026-10-31.
The vendor-family baseline contains 31 confirmed exploited-vulnerability records; the most recent is CVE-2025-39964, added 2026-09-18. This is calibration context, not an exact vulnerability match.
Prioritize monitoring of Linux-associated assets for remote requests, authentication changes, service errors and server-side child processes. Give higher priority to correlated observations across network, web, identity, endpoint telemetry, particularly when an initial access condition is followed by an unexpected process, identity, configuration, file or outbound-network change.
Treat this alert as an evidence-gathering and detection-readiness signal. The forecast indicates elevated exposure priority and does not, by itself, constitute evidence of active exploitation or compromise.
Most Recent Criticality SIGMA Logic
title: Observe Linux network criticality conditions
id: 1e72eaef-fb40-4342-92b0-b4bb8733e153
status: experimental
description: The vendor-family confirmation baseline is anchored by CVE-2025-39964, added 2026-09-18; this context does not equate that record with the present forecast. Observes the current Linux network exposed surface criticality class through network, web, identity, endpoint telemetry, prioritizing remote requests, authentication changes, service errors and server-side child processes.
author: logforce.com
date: 2026/10/15
logsource:
  category: generic
  product: generic
detection:
  selection_network:
    destination.port|exists: true
    network.direction: inbound
  selection_web:
    http.request.method:
      - POST
      - PUT
      - DELETE
    http.response.status_code:
      - 400
      - 401
      - 403
      - 500
  selection_process:
    process.parent.name|exists: true
    process.name|endswith:
      - '\cmd.exe'
      - '\powershell.exe'
      - '/sh'
      - '/bash'
  condition: 1 of selection_*
falsepositives:
  - Approved administration, deployment, maintenance or incident-response activity
level: critical
Experimental Predictive SIGMA Logic
title: Predictive telemetry correlation for Linux network surface
id: 56d4ceff-cb59-485c-9983-94328c8e5a68
status: experimental
description: Correlates anomalous Linux network exposed surface activity across network, web, identity, endpoint telemetry during the observation window from 2026-09-22 through 2027-01-20. It requires multiple related observations around remote requests, authentication changes, service errors and server-side child processes before raising severity for activity consistent with the declared high-complexity network access, no prior privileges and no user interaction path and potential high confidentiality, high integrity, high availability impact.
author: logforce.com
date: 2026/10/15
logsource:
  category: generic
  product: generic
detection:
  selection_network:
    destination.port|exists: true
    network.direction: inbound
  selection_web:
    http.request.method:
      - POST
      - PUT
      - DELETE
    http.response.status_code:
      - 400
      - 401
      - 403
      - 500
  selection_process:
    process.parent.name|exists: true
    process.name|endswith:
      - '\cmd.exe'
      - '\powershell.exe'
      - '/sh'
      - '/bash'
  condition: 2 of selection_*
falsepositives:
  - Approved administration, deployment, maintenance or incident-response activity
level: high
Deployment Queries
SPL:
index=security (event_category=network OR event_category=web OR event_category=authentication OR event_category=process) | eval entity=coalesce(dest,host,user,src), action=coalesce(http_method,action,process_name), result=coalesce(status,http_status) | bucket _time span=5m | stats count dc(src) as sources dc(action) as actions values(result) as results by _time entity | eventstats avg(count) as baseline stdev(count) as deviation by entity | where count > baseline + (2*deviation)

EDR normalized:
(event.category == "process" AND process.parent.name != null AND process.name IN ("cmd.exe","powershell.exe","sh","bash")) OR (event.category == "network" AND network.direction == "inbound")

XDR normalized:
(event.category:process AND process.parent.name:* AND process.name:(cmd.exe OR powershell.exe OR sh OR bash)) OR (event.category:network AND network.direction:inbound)
OBJECTIVE
Detect and prioritize behavioral evidence consistent with suspicious activity targeting a network exposed surface associated with Linux.

IMPORTANT ANALYTIC CONSTRAINT
This detection is predictive and evidence-gathering oriented. Do NOT assume that exploitation is occurring.

Do NOT attribute activity to CVE-2025-39964 or any other specific vulnerability unless independent telemetry provides sufficient evidence.

CVE-2025-39964 is vendor-family historical calibration context only.

THREAT MODEL
Prioritize activity compatible with:

remote network access;
no prior authentication or privileges required;
no user interaction;
high attack complexity;
potential high confidentiality, high integrity, high availability impact.

TARGET SCOPE
Prioritize Linux infrastructure and systems associated with Linux services, management interfaces, appliances, gateways, application endpoints or other network-exposed components.

TELEMETRY TO CORRELATE
Analyze available:

network telemetry;
web telemetry;
identity telemetry;
endpoint telemetry;
service and application errors;
asset exposure and role context.

PRIMARY OBSERVATIONS

NETWORK
Identify inbound connections, especially unusual sources, bursts, increasing frequency, source-diversity changes, uncommon ports and repeated access against the same asset.

WEB
Identify suspicious POST, PUT or DELETE activity correlated with HTTP 400, 401, 403 or 500 responses, malformed requests, unusual paths, unusual parameters or multiple failures followed by behavioral change.

PROCESS EXECUTION
Prioritize a network-facing service temporally associated with child execution of cmd.exe, powershell.exe, sh, bash or another rare shell or interpreter. Increase severity when the parent is normally non-interactive.

IDENTITY
Look for authentication-state changes, unusual account creation, privilege changes, activity without a corresponding legitimate login and authentication behavior inconsistent with the preceding baseline.

CORRELATION
Use a rolling 5-minute window.

Create an elevated detection when at least TWO independent telemetry classes converge around the same target asset, identity, service or execution chain.

Give substantially greater weight to a plausible ordered sequence than to isolated exposure, scanning, errors or administrative activity.

BASELINE / ANOMALY ANALYSIS
For each target entity, compare current behavior against its historical baseline.

Consider:

event volume;
distinct source count;
distinct actions;
error or denial rate;
process rarity and parent-child rarity;
identity, privilege, file or configuration changes.

Treat activity satisfying:

current_count > baseline_mean + 2 * baseline_standard_deviation

as supporting anomaly evidence, not standalone proof of compromise.

SCORING

LOW:
Only expected exposure or one weak, isolated observation is present.

MEDIUM:
Activity is anomalous relative to the asset or identity baseline.

HIGH:
Two independent telemetry classes converge within the correlation window.

CRITICAL:
Suspicious initial activity is followed by unusual process execution, privilege modification, persistence, sensitive file change, configuration change or outbound activity.

FALSE-POSITIVE CONTROL
Before escalating, evaluate whether the activity can reasonably be explained by:

approved administration;
deployment;
vulnerability scanning;
monitoring;
maintenance;
incident-response activity;
known automation;
authorized security testing.

Do not suppress solely because one event resembles legitimate administration. Evaluate temporal sequence, source context, asset role, rarity and cross-telemetry correlation.

REASONING REQUIREMENT
Distinguish explicitly between:

EXPOSURE
The asset or execution surface is reachable, present or available.

SUSPICIOUS ACTIVITY
The surface is receiving anomalous requests, access attempts, inputs or state changes.

POST-ACCESS EVIDENCE
Endpoint, process, identity, file, configuration or outbound-network telemetry indicates that the suspicious activity may have produced an effect.

Never classify EXPOSURE alone as successful exploitation.

OUTPUT
Return:

{
  "verdict": "BENIGN | EXPOSURE | SUSPICIOUS_ACTIVITY | POSSIBLE_EXPLOITATION | HIGH_CONFIDENCE_COMPROMISE",
  "confidence": 0-100,
  "severity": "LOW | MEDIUM | HIGH | CRITICAL",
  "target_asset": "",
  "time_window": "",
  "observed_signals": [],
  "correlated_signals": [],
  "anomalies": [],
  "process_chain": [],
  "network_sources": [],
  "identity_changes": [],
  "legitimate_explanations": [],
  "evidence_for": [],
  "evidence_against": [],
  "recommended_investigation": [],
  "reasoning_summary": ""
}

DECISION POLICY
Prefer evidence over prediction.

Do not claim exploitation from vulnerability severity, vendor history, forecast dates, exposure, errors or anomaly scores alone.

Escalate toward POSSIBLE_EXPLOITATION only when telemetry supports a plausible causal sequence such as:

external inbound request
-> Linux-associated network-facing service
-> anomalous response or service behavior
-> unexpected child process, identity change, persistence or outbound activity

Escalate toward HIGH_CONFIDENCE_COMPROMISE only when multiple independent post-access signals corroborate the sequence.
Apple
2026-09-17
2026-10-27
HIGH (8.8)
STIX 2.1 Alert
Apple is ranked for a network-exposed surface with CVSS 8.8. The declared path is low-complexity network access, no prior privileges and required user interaction and may affect high confidentiality, high integrity, high availability.
The projected trigger peak is 2026-10-27.
The vendor-family baseline contains 94 confirmed exploited-vulnerability records; the most recent is CVE-2026-65400, added 2026-08-18. This is calibration context, not an exact vulnerability match.
Prioritize monitoring of Apple-associated assets for remote requests, authentication changes, service errors and server-side child processes. Give higher priority to correlated observations across network, web, identity, endpoint telemetry, particularly when an initial access condition is followed by an unexpected process, identity, configuration, file or outbound-network change.
Treat this alert as an evidence-gathering and detection-readiness signal. The forecast indicates elevated exposure priority and does not, by itself, constitute evidence of active exploitation or compromise.
Most Recent Criticality SIGMA Logic
title: Observe Apple network criticality conditions
id: 1f9e23c4-1b29-41d7-825d-3448d2f0f041
status: experimental
description: The vendor-family confirmation baseline is anchored by CVE-2026-65400, added 2026-08-18; this context does not equate that record with the present forecast. Observes the current Apple network exposed surface criticality class through network, web, identity, endpoint telemetry, prioritizing remote requests, authentication changes, service errors and server-side child processes.
author: logforce.com
date: 2026/09/20
logsource:
  category: generic
  product: generic
detection:
  selection_network:
    destination.port|exists: true
    network.direction: inbound
  selection_web:
    http.request.method:
      - POST
      - PUT
      - DELETE
    http.response.status_code:
      - 400
      - 401
      - 403
      - 500
  selection_process:
    process.parent.name|exists: true
    process.name|endswith:
      - '\cmd.exe'
      - '\powershell.exe'
      - '/sh'
      - '/bash'
  condition: 1 of selection_*
falsepositives:
  - Approved administration, deployment, maintenance or incident-response activity
level: high
Experimental Predictive SIGMA Logic
title: Predictive telemetry correlation for Apple network surface
id: c51523ea-5947-4918-9a19-2aa84a82e1d1
status: experimental
description: Correlates anomalous Apple network exposed surface activity across network, web, identity, endpoint telemetry during the observation window from 2026-09-17 through 2027-01-15. It requires multiple related observations around remote requests, authentication changes, service errors and server-side child processes before raising severity for activity consistent with the declared low-complexity network access, no prior privileges and required user interaction path and potential high confidentiality, high integrity, high availability impact.
author: logforce.com
date: 2026/09/20
logsource:
  category: generic
  product: generic
detection:
  selection_network:
    destination.port|exists: true
    network.direction: inbound
  selection_web:
    http.request.method:
      - POST
      - PUT
      - DELETE
    http.response.status_code:
      - 400
      - 401
      - 403
      - 500
  selection_process:
    process.parent.name|exists: true
    process.name|endswith:
      - '\cmd.exe'
      - '\powershell.exe'
      - '/sh'
      - '/bash'
  condition: 2 of selection_*
falsepositives:
  - Approved administration, deployment, maintenance or incident-response activity
level: high
Deployment Queries
SPL:
index=security (event_category=network OR event_category=web OR event_category=authentication OR event_category=process) | eval entity=coalesce(dest,host,user,src), action=coalesce(http_method,action,process_name), result=coalesce(status,http_status) | bucket _time span=5m | stats count dc(src) as sources dc(action) as actions values(result) as results by _time entity | eventstats avg(count) as baseline stdev(count) as deviation by entity | where count > baseline + (2*deviation)

EDR normalized:
(event.category == "process" AND process.parent.name != null AND process.name IN ("cmd.exe","powershell.exe","sh","bash")) OR (event.category == "network" AND network.direction == "inbound")

XDR normalized:
(event.category:process AND process.parent.name:* AND process.name:(cmd.exe OR powershell.exe OR sh OR bash)) OR (event.category:network AND network.direction:inbound)
OBJECTIVE
Detect and prioritize behavioral evidence consistent with suspicious activity targeting a network exposed surface associated with Apple.

IMPORTANT ANALYTIC CONSTRAINT
This detection is predictive and evidence-gathering oriented. Do NOT assume that exploitation is occurring.

Do NOT attribute activity to CVE-2026-65400 or any other specific vulnerability unless independent telemetry provides sufficient evidence.

CVE-2026-65400 is vendor-family historical calibration context only.

THREAT MODEL
Prioritize activity compatible with:

remote network access;
no prior authentication or privileges required;
user interaction required;
low attack complexity;
potential high confidentiality, high integrity, high availability impact.

TARGET SCOPE
Prioritize Apple infrastructure and systems associated with Apple services, management interfaces, appliances, gateways, application endpoints or other network-exposed components.

TELEMETRY TO CORRELATE
Analyze available:

network telemetry;
web telemetry;
identity telemetry;
endpoint telemetry;
service and application errors;
asset exposure and role context.

PRIMARY OBSERVATIONS

NETWORK
Identify inbound connections, especially unusual sources, bursts, increasing frequency, source-diversity changes, uncommon ports and repeated access against the same asset.

WEB
Identify suspicious POST, PUT or DELETE activity correlated with HTTP 400, 401, 403 or 500 responses, malformed requests, unusual paths, unusual parameters or multiple failures followed by behavioral change.

PROCESS EXECUTION
Prioritize a network-facing service temporally associated with child execution of cmd.exe, powershell.exe, sh, bash or another rare shell or interpreter. Increase severity when the parent is normally non-interactive.

IDENTITY
Look for authentication-state changes, unusual account creation, privilege changes, activity without a corresponding legitimate login and authentication behavior inconsistent with the preceding baseline.

CORRELATION
Use a rolling 5-minute window.

Create an elevated detection when at least TWO independent telemetry classes converge around the same target asset, identity, service or execution chain.

Give substantially greater weight to a plausible ordered sequence than to isolated exposure, scanning, errors or administrative activity.

BASELINE / ANOMALY ANALYSIS
For each target entity, compare current behavior against its historical baseline.

Consider:

event volume;
distinct source count;
distinct actions;
error or denial rate;
process rarity and parent-child rarity;
identity, privilege, file or configuration changes.

Treat activity satisfying:

current_count > baseline_mean + 2 * baseline_standard_deviation

as supporting anomaly evidence, not standalone proof of compromise.

SCORING

LOW:
Only expected exposure or one weak, isolated observation is present.

MEDIUM:
Activity is anomalous relative to the asset or identity baseline.

HIGH:
Two independent telemetry classes converge within the correlation window.

CRITICAL:
Suspicious initial activity is followed by unusual process execution, privilege modification, persistence, sensitive file change, configuration change or outbound activity.

FALSE-POSITIVE CONTROL
Before escalating, evaluate whether the activity can reasonably be explained by:

approved administration;
deployment;
vulnerability scanning;
monitoring;
maintenance;
incident-response activity;
known automation;
authorized security testing.

Do not suppress solely because one event resembles legitimate administration. Evaluate temporal sequence, source context, asset role, rarity and cross-telemetry correlation.

REASONING REQUIREMENT
Distinguish explicitly between:

EXPOSURE
The asset or execution surface is reachable, present or available.

SUSPICIOUS ACTIVITY
The surface is receiving anomalous requests, access attempts, inputs or state changes.

POST-ACCESS EVIDENCE
Endpoint, process, identity, file, configuration or outbound-network telemetry indicates that the suspicious activity may have produced an effect.

Never classify EXPOSURE alone as successful exploitation.

OUTPUT
Return:

{
  "verdict": "BENIGN | EXPOSURE | SUSPICIOUS_ACTIVITY | POSSIBLE_EXPLOITATION | HIGH_CONFIDENCE_COMPROMISE",
  "confidence": 0-100,
  "severity": "LOW | MEDIUM | HIGH | CRITICAL",
  "target_asset": "",
  "time_window": "",
  "observed_signals": [],
  "correlated_signals": [],
  "anomalies": [],
  "process_chain": [],
  "network_sources": [],
  "identity_changes": [],
  "legitimate_explanations": [],
  "evidence_for": [],
  "evidence_against": [],
  "recommended_investigation": [],
  "reasoning_summary": ""
}

DECISION POLICY
Prefer evidence over prediction.

Do not claim exploitation from vulnerability severity, vendor history, forecast dates, exposure, errors or anomaly scores alone.

Escalate toward POSSIBLE_EXPLOITATION only when telemetry supports a plausible causal sequence such as:

external inbound request
-> Apple-associated network-facing service
-> anomalous response or service behavior
-> unexpected child process, identity change, persistence or outbound activity

Escalate toward HIGH_CONFIDENCE_COMPROMISE only when multiple independent post-access signals corroborate the sequence.
Cesanta
2026-09-10
2026-10-26
CRITICAL (9.8)
STIX 2.1 Alert
Cesanta is ranked for a network-exposed surface with CVSS 9.8. The declared path is low-complexity network access, no prior privileges and no user interaction and may affect high confidentiality, high integrity, high availability.
The projected trigger peak is 2026-10-26.
No direct confirmed vendor-family baseline is present in the current catalog; this record remains predictive.
Prioritize monitoring of Cesanta-associated assets for remote requests, authentication changes, service errors and server-side child processes. Give higher priority to correlated observations across network, web, identity, endpoint telemetry, particularly when an initial access condition is followed by an unexpected process, identity, configuration, file or outbound-network change.
Treat this alert as an evidence-gathering and detection-readiness signal. The forecast indicates elevated exposure priority and does not, by itself, constitute evidence of active exploitation or compromise.
Most Recent Criticality SIGMA Logic
title: Observe Cesanta network criticality conditions
id: 2c5387ba-fb7e-408c-90cd-8ff9a6d7736f
status: experimental
description: No direct vendor-family confirmation baseline is present in the current confirmed-exploitation catalog. Observes the current Cesanta network exposed surface criticality class through network, web, identity, endpoint telemetry, prioritizing remote requests, authentication changes, service errors and server-side child processes.
author: logforce.com
date: 2026/09/17
logsource:
  category: generic
  product: generic
detection:
  selection_network:
    destination.port|exists: true
    network.direction: inbound
  selection_web:
    http.request.method:
      - POST
      - PUT
      - DELETE
    http.response.status_code:
      - 400
      - 401
      - 403
      - 500
  selection_process:
    process.parent.name|exists: true
    process.name|endswith:
      - '\cmd.exe'
      - '\powershell.exe'
      - '/sh'
      - '/bash'
  condition: 1 of selection_*
falsepositives:
  - Approved administration, deployment, maintenance or incident-response activity
level: critical
Experimental Predictive SIGMA Logic
title: Predictive telemetry correlation for Cesanta network surface
id: 400e4b07-34a8-46ce-82d3-c2aff045dd6c
status: experimental
description: Correlates anomalous Cesanta network exposed surface activity across network, web, identity, endpoint telemetry during the observation window from 2026-09-10 through 2027-01-08. It requires multiple related observations around remote requests, authentication changes, service errors and server-side child processes before raising severity for activity consistent with the declared low-complexity network access, no prior privileges and no user interaction path and potential high confidentiality, high integrity, high availability impact.
author: logforce.com
date: 2026/09/17
logsource:
  category: generic
  product: generic
detection:
  selection_network:
    destination.port|exists: true
    network.direction: inbound
  selection_web:
    http.request.method:
      - POST
      - PUT
      - DELETE
    http.response.status_code:
      - 400
      - 401
      - 403
      - 500
  selection_process:
    process.parent.name|exists: true
    process.name|endswith:
      - '\cmd.exe'
      - '\powershell.exe'
      - '/sh'
      - '/bash'
  condition: 2 of selection_*
falsepositives:
  - Approved administration, deployment, maintenance or incident-response activity
level: high
Deployment Queries
SPL:
index=security (event_category=network OR event_category=web OR event_category=authentication OR event_category=process) | eval entity=coalesce(dest,host,user,src), action=coalesce(http_method,action,process_name), result=coalesce(status,http_status) | bucket _time span=5m | stats count dc(src) as sources dc(action) as actions values(result) as results by _time entity | eventstats avg(count) as baseline stdev(count) as deviation by entity | where count > baseline + (2*deviation)

EDR normalized:
(event.category == "process" AND process.parent.name != null AND process.name IN ("cmd.exe","powershell.exe","sh","bash")) OR (event.category == "network" AND network.direction == "inbound")

XDR normalized:
(event.category:process AND process.parent.name:* AND process.name:(cmd.exe OR powershell.exe OR sh OR bash)) OR (event.category:network AND network.direction:inbound)
OBJECTIVE
Detect and prioritize behavioral evidence consistent with suspicious activity targeting a network exposed surface associated with Cesanta.

IMPORTANT ANALYTIC CONSTRAINT
This detection is predictive and evidence-gathering oriented. Do NOT assume that exploitation is occurring.

No specific vulnerability identifier is established by this forecast. Do NOT invent or infer a CVE from vendor identity, severity, exposure or observed errors.

THREAT MODEL
Prioritize activity compatible with:

remote network access;
no prior authentication or privileges required;
no user interaction;
low attack complexity;
potential high confidentiality, high integrity, high availability impact.

TARGET SCOPE
Prioritize Cesanta infrastructure and systems associated with Cesanta services, management interfaces, appliances, gateways, application endpoints or other network-exposed components.

TELEMETRY TO CORRELATE
Analyze available:

network telemetry;
web telemetry;
identity telemetry;
endpoint telemetry;
service and application errors;
asset exposure and role context.

PRIMARY OBSERVATIONS

NETWORK
Identify inbound connections, especially unusual sources, bursts, increasing frequency, source-diversity changes, uncommon ports and repeated access against the same asset.

WEB
Identify suspicious POST, PUT or DELETE activity correlated with HTTP 400, 401, 403 or 500 responses, malformed requests, unusual paths, unusual parameters or multiple failures followed by behavioral change.

PROCESS EXECUTION
Prioritize a network-facing service temporally associated with child execution of cmd.exe, powershell.exe, sh, bash or another rare shell or interpreter. Increase severity when the parent is normally non-interactive.

IDENTITY
Look for authentication-state changes, unusual account creation, privilege changes, activity without a corresponding legitimate login and authentication behavior inconsistent with the preceding baseline.

CORRELATION
Use a rolling 5-minute window.

Create an elevated detection when at least TWO independent telemetry classes converge around the same target asset, identity, service or execution chain.

Give substantially greater weight to a plausible ordered sequence than to isolated exposure, scanning, errors or administrative activity.

BASELINE / ANOMALY ANALYSIS
For each target entity, compare current behavior against its historical baseline.

Consider:

event volume;
distinct source count;
distinct actions;
error or denial rate;
process rarity and parent-child rarity;
identity, privilege, file or configuration changes.

Treat activity satisfying:

current_count > baseline_mean + 2 * baseline_standard_deviation

as supporting anomaly evidence, not standalone proof of compromise.

SCORING

LOW:
Only expected exposure or one weak, isolated observation is present.

MEDIUM:
Activity is anomalous relative to the asset or identity baseline.

HIGH:
Two independent telemetry classes converge within the correlation window.

CRITICAL:
Suspicious initial activity is followed by unusual process execution, privilege modification, persistence, sensitive file change, configuration change or outbound activity.

FALSE-POSITIVE CONTROL
Before escalating, evaluate whether the activity can reasonably be explained by:

approved administration;
deployment;
vulnerability scanning;
monitoring;
maintenance;
incident-response activity;
known automation;
authorized security testing.

Do not suppress solely because one event resembles legitimate administration. Evaluate temporal sequence, source context, asset role, rarity and cross-telemetry correlation.

REASONING REQUIREMENT
Distinguish explicitly between:

EXPOSURE
The asset or execution surface is reachable, present or available.

SUSPICIOUS ACTIVITY
The surface is receiving anomalous requests, access attempts, inputs or state changes.

POST-ACCESS EVIDENCE
Endpoint, process, identity, file, configuration or outbound-network telemetry indicates that the suspicious activity may have produced an effect.

Never classify EXPOSURE alone as successful exploitation.

OUTPUT
Return:

{
  "verdict": "BENIGN | EXPOSURE | SUSPICIOUS_ACTIVITY | POSSIBLE_EXPLOITATION | HIGH_CONFIDENCE_COMPROMISE",
  "confidence": 0-100,
  "severity": "LOW | MEDIUM | HIGH | CRITICAL",
  "target_asset": "",
  "time_window": "",
  "observed_signals": [],
  "correlated_signals": [],
  "anomalies": [],
  "process_chain": [],
  "network_sources": [],
  "identity_changes": [],
  "legitimate_explanations": [],
  "evidence_for": [],
  "evidence_against": [],
  "recommended_investigation": [],
  "reasoning_summary": ""
}

DECISION POLICY
Prefer evidence over prediction.

Do not claim exploitation from vulnerability severity, vendor history, forecast dates, exposure, errors or anomaly scores alone.

Escalate toward POSSIBLE_EXPLOITATION only when telemetry supports a plausible causal sequence such as:

external inbound request
-> Cesanta-associated network-facing service
-> anomalous response or service behavior
-> unexpected child process, identity change, persistence or outbound activity

Escalate toward HIGH_CONFIDENCE_COMPROMISE only when multiple independent post-access signals corroborate the sequence.
ASUS
2026-09-02
2026-10-15
CRITICAL (10.0)
STIX 2.1 Alert
ASUS is ranked for a network-exposed surface with CVSS 10. The declared path is low-complexity network access, no prior privileges and no user interaction and may affect high confidentiality, high integrity, high availability.
The projected trigger peak is 2026-10-15.
The vendor-family baseline contains 3 confirmed exploited-vulnerability records; the most recent is CVE-2025-59374, added 2025-12-17. This is calibration context, not an exact vulnerability match.
Prioritize monitoring of ASUS-associated assets for remote requests, authentication changes, service errors and server-side child processes. Give higher priority to correlated observations across network, web, identity, endpoint telemetry, particularly when an initial access condition is followed by an unexpected process, identity, configuration, file or outbound-network change.
Treat this alert as an evidence-gathering and detection-readiness signal. The forecast indicates elevated exposure priority and does not, by itself, constitute evidence of active exploitation or compromise.
Most Recent Criticality SIGMA Logic
title: Observe ASUS network criticality conditions
id: 0eb89dcb-ac2e-443c-9db2-fb6076b7e7ca
status: experimental
description: The vendor-family confirmation baseline is anchored by CVE-2025-59374, added 2025-12-17; this context does not equate that record with the present forecast. Observes the current ASUS network exposed surface criticality class through network, web, identity, endpoint telemetry, prioritizing remote requests, authentication changes, service errors and server-side child processes.
author: logforce.com
date: 2026/09/05
logsource:
  category: generic
  product: generic
detection:
  selection_network:
    destination.port|exists: true
    network.direction: inbound
  selection_web:
    http.request.method:
      - POST
      - PUT
      - DELETE
    http.response.status_code:
      - 400
      - 401
      - 403
      - 500
  selection_process:
    process.parent.name|exists: true
    process.name|endswith:
      - '\cmd.exe'
      - '\powershell.exe'
      - '/sh'
      - '/bash'
  condition: 1 of selection_*
falsepositives:
  - Approved administration, deployment, maintenance or incident-response activity
level: critical
Experimental Predictive SIGMA Logic
title: Predictive telemetry correlation for ASUS network surface
id: f7e46172-4ba9-452a-94d2-53eda1314bea
status: experimental
description: Correlates anomalous ASUS network exposed surface activity across network, web, identity, endpoint telemetry during the observation window from 2026-09-02 through 2026-12-31. It requires multiple related observations around remote requests, authentication changes, service errors and server-side child processes before raising severity for activity consistent with the declared low-complexity network access, no prior privileges and no user interaction path and potential high confidentiality, high integrity, high availability impact.
author: logforce.com
date: 2026/09/05
logsource:
  category: generic
  product: generic
detection:
  selection_network:
    destination.port|exists: true
    network.direction: inbound
  selection_web:
    http.request.method:
      - POST
      - PUT
      - DELETE
    http.response.status_code:
      - 400
      - 401
      - 403
      - 500
  selection_process:
    process.parent.name|exists: true
    process.name|endswith:
      - '\cmd.exe'
      - '\powershell.exe'
      - '/sh'
      - '/bash'
  condition: 2 of selection_*
falsepositives:
  - Approved administration, deployment, maintenance or incident-response activity
level: high
Deployment Queries
SPL:
index=security (event_category=network OR event_category=web OR event_category=authentication OR event_category=process) | eval entity=coalesce(dest,host,user,src), action=coalesce(http_method,action,process_name), result=coalesce(status,http_status) | bucket _time span=5m | stats count dc(src) as sources dc(action) as actions values(result) as results by _time entity | eventstats avg(count) as baseline stdev(count) as deviation by entity | where count > baseline + (2*deviation)

EDR normalized:
(event.category == "process" AND process.parent.name != null AND process.name IN ("cmd.exe","powershell.exe","sh","bash")) OR (event.category == "network" AND network.direction == "inbound")

XDR normalized:
(event.category:process AND process.parent.name:* AND process.name:(cmd.exe OR powershell.exe OR sh OR bash)) OR (event.category:network AND network.direction:inbound)
OBJECTIVE
Detect and prioritize behavioral evidence consistent with suspicious activity targeting a network exposed surface associated with ASUS.

IMPORTANT ANALYTIC CONSTRAINT
This detection is predictive and evidence-gathering oriented. Do NOT assume that exploitation is occurring.

Do NOT attribute activity to CVE-2025-59374 or any other specific vulnerability unless independent telemetry provides sufficient evidence.

CVE-2025-59374 is vendor-family historical calibration context only.

THREAT MODEL
Prioritize activity compatible with:

remote network access;
no prior authentication or privileges required;
no user interaction;
low attack complexity;
potential high confidentiality, high integrity, high availability impact.

TARGET SCOPE
Prioritize ASUS infrastructure and systems associated with ASUS services, management interfaces, appliances, gateways, application endpoints or other network-exposed components.

TELEMETRY TO CORRELATE
Analyze available:

network telemetry;
web telemetry;
identity telemetry;
endpoint telemetry;
service and application errors;
asset exposure and role context.

PRIMARY OBSERVATIONS

NETWORK
Identify inbound connections, especially unusual sources, bursts, increasing frequency, source-diversity changes, uncommon ports and repeated access against the same asset.

WEB
Identify suspicious POST, PUT or DELETE activity correlated with HTTP 400, 401, 403 or 500 responses, malformed requests, unusual paths, unusual parameters or multiple failures followed by behavioral change.

PROCESS EXECUTION
Prioritize a network-facing service temporally associated with child execution of cmd.exe, powershell.exe, sh, bash or another rare shell or interpreter. Increase severity when the parent is normally non-interactive.

IDENTITY
Look for authentication-state changes, unusual account creation, privilege changes, activity without a corresponding legitimate login and authentication behavior inconsistent with the preceding baseline.

CORRELATION
Use a rolling 5-minute window.

Create an elevated detection when at least TWO independent telemetry classes converge around the same target asset, identity, service or execution chain.

Give substantially greater weight to a plausible ordered sequence than to isolated exposure, scanning, errors or administrative activity.

BASELINE / ANOMALY ANALYSIS
For each target entity, compare current behavior against its historical baseline.

Consider:

event volume;
distinct source count;
distinct actions;
error or denial rate;
process rarity and parent-child rarity;
identity, privilege, file or configuration changes.

Treat activity satisfying:

current_count > baseline_mean + 2 * baseline_standard_deviation

as supporting anomaly evidence, not standalone proof of compromise.

SCORING

LOW:
Only expected exposure or one weak, isolated observation is present.

MEDIUM:
Activity is anomalous relative to the asset or identity baseline.

HIGH:
Two independent telemetry classes converge within the correlation window.

CRITICAL:
Suspicious initial activity is followed by unusual process execution, privilege modification, persistence, sensitive file change, configuration change or outbound activity.

FALSE-POSITIVE CONTROL
Before escalating, evaluate whether the activity can reasonably be explained by:

approved administration;
deployment;
vulnerability scanning;
monitoring;
maintenance;
incident-response activity;
known automation;
authorized security testing.

Do not suppress solely because one event resembles legitimate administration. Evaluate temporal sequence, source context, asset role, rarity and cross-telemetry correlation.

REASONING REQUIREMENT
Distinguish explicitly between:

EXPOSURE
The asset or execution surface is reachable, present or available.

SUSPICIOUS ACTIVITY
The surface is receiving anomalous requests, access attempts, inputs or state changes.

POST-ACCESS EVIDENCE
Endpoint, process, identity, file, configuration or outbound-network telemetry indicates that the suspicious activity may have produced an effect.

Never classify EXPOSURE alone as successful exploitation.

OUTPUT
Return:

{
  "verdict": "BENIGN | EXPOSURE | SUSPICIOUS_ACTIVITY | POSSIBLE_EXPLOITATION | HIGH_CONFIDENCE_COMPROMISE",
  "confidence": 0-100,
  "severity": "LOW | MEDIUM | HIGH | CRITICAL",
  "target_asset": "",
  "time_window": "",
  "observed_signals": [],
  "correlated_signals": [],
  "anomalies": [],
  "process_chain": [],
  "network_sources": [],
  "identity_changes": [],
  "legitimate_explanations": [],
  "evidence_for": [],
  "evidence_against": [],
  "recommended_investigation": [],
  "reasoning_summary": ""
}

DECISION POLICY
Prefer evidence over prediction.

Do not claim exploitation from vulnerability severity, vendor history, forecast dates, exposure, errors or anomaly scores alone.

Escalate toward POSSIBLE_EXPLOITATION only when telemetry supports a plausible causal sequence such as:

external inbound request
-> ASUS-associated network-facing service
-> anomalous response or service behavior
-> unexpected child process, identity change, persistence or outbound activity

Escalate toward HIGH_CONFIDENCE_COMPROMISE only when multiple independent post-access signals corroborate the sequence.
NVIDIA
2026-09-02
2026-10-17
CRITICAL (10.0)
STIX 2.1 Alert
NVIDIA is ranked for a network-exposed surface with CVSS 10. The declared path is low-complexity network access, no prior privileges and no user interaction and may affect high confidentiality, high integrity, high availability.
The projected trigger peak is 2026-10-17.
No direct confirmed vendor-family baseline is present in the current catalog; this record remains predictive.
Prioritize monitoring of NVIDIA-associated assets for remote requests, authentication changes, service errors and server-side child processes. Give higher priority to correlated observations across network, web, identity, endpoint telemetry, particularly when an initial access condition is followed by an unexpected process, identity, configuration, file or outbound-network change.
Treat this alert as an evidence-gathering and detection-readiness signal. The forecast indicates elevated exposure priority and does not, by itself, constitute evidence of active exploitation or compromise.
Most Recent Criticality SIGMA Logic
title: Observe NVIDIA network criticality conditions
id: df8e16ed-ede5-4939-826b-0f01c1c3c2fe
status: experimental
description: No direct vendor-family confirmation baseline is present in the current confirmed-exploitation catalog. Observes the current NVIDIA network exposed surface criticality class through network, web, identity, endpoint telemetry, prioritizing remote requests, authentication changes, service errors and server-side child processes.
author: logforce.com
date: 2026/09/05
logsource:
  category: generic
  product: generic
detection:
  selection_network:
    destination.port|exists: true
    network.direction: inbound
  selection_web:
    http.request.method:
      - POST
      - PUT
      - DELETE
    http.response.status_code:
      - 400
      - 401
      - 403
      - 500
  selection_process:
    process.parent.name|exists: true
    process.name|endswith:
      - '\cmd.exe'
      - '\powershell.exe'
      - '/sh'
      - '/bash'
  condition: 1 of selection_*
falsepositives:
  - Approved administration, deployment, maintenance or incident-response activity
level: critical
Experimental Predictive SIGMA Logic
title: Predictive telemetry correlation for NVIDIA network surface
id: 558efb7b-267b-4d08-aa79-28feb0349473
status: experimental
description: Correlates anomalous NVIDIA network exposed surface activity across network, web, identity, endpoint telemetry during the observation window from 2026-09-02 through 2026-12-31. It requires multiple related observations around remote requests, authentication changes, service errors and server-side child processes before raising severity for activity consistent with the declared low-complexity network access, no prior privileges and no user interaction path and potential high confidentiality, high integrity, high availability impact.
author: logforce.com
date: 2026/09/05
logsource:
  category: generic
  product: generic
detection:
  selection_network:
    destination.port|exists: true
    network.direction: inbound
  selection_web:
    http.request.method:
      - POST
      - PUT
      - DELETE
    http.response.status_code:
      - 400
      - 401
      - 403
      - 500
  selection_process:
    process.parent.name|exists: true
    process.name|endswith:
      - '\cmd.exe'
      - '\powershell.exe'
      - '/sh'
      - '/bash'
  condition: 2 of selection_*
falsepositives:
  - Approved administration, deployment, maintenance or incident-response activity
level: high
Deployment Queries
SPL:
index=security (event_category=network OR event_category=web OR event_category=authentication OR event_category=process) | eval entity=coalesce(dest,host,user,src), action=coalesce(http_method,action,process_name), result=coalesce(status,http_status) | bucket _time span=5m | stats count dc(src) as sources dc(action) as actions values(result) as results by _time entity | eventstats avg(count) as baseline stdev(count) as deviation by entity | where count > baseline + (2*deviation)

EDR normalized:
(event.category == "process" AND process.parent.name != null AND process.name IN ("cmd.exe","powershell.exe","sh","bash")) OR (event.category == "network" AND network.direction == "inbound")

XDR normalized:
(event.category:process AND process.parent.name:* AND process.name:(cmd.exe OR powershell.exe OR sh OR bash)) OR (event.category:network AND network.direction:inbound)
OBJECTIVE
Detect and prioritize behavioral evidence consistent with suspicious activity targeting a network exposed surface associated with NVIDIA.

IMPORTANT ANALYTIC CONSTRAINT
This detection is predictive and evidence-gathering oriented. Do NOT assume that exploitation is occurring.

No specific vulnerability identifier is established by this forecast. Do NOT invent or infer a CVE from vendor identity, severity, exposure or observed errors.

THREAT MODEL
Prioritize activity compatible with:

remote network access;
no prior authentication or privileges required;
no user interaction;
low attack complexity;
potential high confidentiality, high integrity, high availability impact.

TARGET SCOPE
Prioritize NVIDIA infrastructure and systems associated with NVIDIA services, management interfaces, appliances, gateways, application endpoints or other network-exposed components.

TELEMETRY TO CORRELATE
Analyze available:

network telemetry;
web telemetry;
identity telemetry;
endpoint telemetry;
service and application errors;
asset exposure and role context.

PRIMARY OBSERVATIONS

NETWORK
Identify inbound connections, especially unusual sources, bursts, increasing frequency, source-diversity changes, uncommon ports and repeated access against the same asset.

WEB
Identify suspicious POST, PUT or DELETE activity correlated with HTTP 400, 401, 403 or 500 responses, malformed requests, unusual paths, unusual parameters or multiple failures followed by behavioral change.

PROCESS EXECUTION
Prioritize a network-facing service temporally associated with child execution of cmd.exe, powershell.exe, sh, bash or another rare shell or interpreter. Increase severity when the parent is normally non-interactive.

IDENTITY
Look for authentication-state changes, unusual account creation, privilege changes, activity without a corresponding legitimate login and authentication behavior inconsistent with the preceding baseline.

CORRELATION
Use a rolling 5-minute window.

Create an elevated detection when at least TWO independent telemetry classes converge around the same target asset, identity, service or execution chain.

Give substantially greater weight to a plausible ordered sequence than to isolated exposure, scanning, errors or administrative activity.

BASELINE / ANOMALY ANALYSIS
For each target entity, compare current behavior against its historical baseline.

Consider:

event volume;
distinct source count;
distinct actions;
error or denial rate;
process rarity and parent-child rarity;
identity, privilege, file or configuration changes.

Treat activity satisfying:

current_count > baseline_mean + 2 * baseline_standard_deviation

as supporting anomaly evidence, not standalone proof of compromise.

SCORING

LOW:
Only expected exposure or one weak, isolated observation is present.

MEDIUM:
Activity is anomalous relative to the asset or identity baseline.

HIGH:
Two independent telemetry classes converge within the correlation window.

CRITICAL:
Suspicious initial activity is followed by unusual process execution, privilege modification, persistence, sensitive file change, configuration change or outbound activity.

FALSE-POSITIVE CONTROL
Before escalating, evaluate whether the activity can reasonably be explained by:

approved administration;
deployment;
vulnerability scanning;
monitoring;
maintenance;
incident-response activity;
known automation;
authorized security testing.

Do not suppress solely because one event resembles legitimate administration. Evaluate temporal sequence, source context, asset role, rarity and cross-telemetry correlation.

REASONING REQUIREMENT
Distinguish explicitly between:

EXPOSURE
The asset or execution surface is reachable, present or available.

SUSPICIOUS ACTIVITY
The surface is receiving anomalous requests, access attempts, inputs or state changes.

POST-ACCESS EVIDENCE
Endpoint, process, identity, file, configuration or outbound-network telemetry indicates that the suspicious activity may have produced an effect.

Never classify EXPOSURE alone as successful exploitation.

OUTPUT
Return:

{
  "verdict": "BENIGN | EXPOSURE | SUSPICIOUS_ACTIVITY | POSSIBLE_EXPLOITATION | HIGH_CONFIDENCE_COMPROMISE",
  "confidence": 0-100,
  "severity": "LOW | MEDIUM | HIGH | CRITICAL",
  "target_asset": "",
  "time_window": "",
  "observed_signals": [],
  "correlated_signals": [],
  "anomalies": [],
  "process_chain": [],
  "network_sources": [],
  "identity_changes": [],
  "legitimate_explanations": [],
  "evidence_for": [],
  "evidence_against": [],
  "recommended_investigation": [],
  "reasoning_summary": ""
}

DECISION POLICY
Prefer evidence over prediction.

Do not claim exploitation from vulnerability severity, vendor history, forecast dates, exposure, errors or anomaly scores alone.

Escalate toward POSSIBLE_EXPLOITATION only when telemetry supports a plausible causal sequence such as:

external inbound request
-> NVIDIA-associated network-facing service
-> anomalous response or service behavior
-> unexpected child process, identity change, persistence or outbound activity

Escalate toward HIGH_CONFIDENCE_COMPROMISE only when multiple independent post-access signals corroborate the sequence.
Ultralytics
2026-08-26
2026-10-17
HIGH (8.8)
STIX 2.1 Alert
Ultralytics is ranked for a network-exposed surface with CVSS 8.8. The declared path is low-complexity network access, no prior privileges and required user interaction and may affect high confidentiality, high integrity, high availability.
The projected trigger peak is 2026-10-17.
No direct confirmed vendor-family baseline is present in the current catalog; this record remains predictive.
Prioritize monitoring of Ultralytics-associated assets for remote requests, authentication changes, service errors and server-side child processes. Give higher priority to correlated observations across network, web, identity, endpoint telemetry, particularly when an initial access condition is followed by an unexpected process, identity, configuration, file or outbound-network change.
Treat this alert as an evidence-gathering and detection-readiness signal. The forecast indicates elevated exposure priority and does not, by itself, constitute evidence of active exploitation or compromise.
Most Recent Criticality SIGMA Logic
title: Observe Ultralytics network criticality conditions
id: 9eada8af-6858-4a3f-8de4-3036ac509f0e
status: experimental
description: No direct vendor-family confirmation baseline is present in the current confirmed-exploitation catalog. Observes the current Ultralytics network exposed surface criticality class through network, web, identity, endpoint telemetry, prioritizing remote requests, authentication changes, service errors and server-side child processes.
author: logforce.com
date: 2026/09/05
logsource:
  category: generic
  product: generic
detection:
  selection_network:
    destination.port|exists: true
    network.direction: inbound
  selection_web:
    http.request.method:
      - POST
      - PUT
      - DELETE
    http.response.status_code:
      - 400
      - 401
      - 403
      - 500
  selection_process:
    process.parent.name|exists: true
    process.name|endswith:
      - '\cmd.exe'
      - '\powershell.exe'
      - '/sh'
      - '/bash'
  condition: 1 of selection_*
falsepositives:
  - Approved administration, deployment, maintenance or incident-response activity
level: high
Experimental Predictive SIGMA Logic
title: Predictive telemetry correlation for Ultralytics network surface
id: b32c6e39-0ed2-484f-8a52-118f957ed8e1
status: experimental
description: Correlates anomalous Ultralytics network exposed surface activity across network, web, identity, endpoint telemetry during the observation window from 2026-08-26 through 2026-12-24. It requires multiple related observations around remote requests, authentication changes, service errors and server-side child processes before raising severity for activity consistent with the declared low-complexity network access, no prior privileges and required user interaction path and potential high confidentiality, high integrity, high availability impact.
author: logforce.com
date: 2026/09/05
logsource:
  category: generic
  product: generic
detection:
  selection_network:
    destination.port|exists: true
    network.direction: inbound
  selection_web:
    http.request.method:
      - POST
      - PUT
      - DELETE
    http.response.status_code:
      - 400
      - 401
      - 403
      - 500
  selection_process:
    process.parent.name|exists: true
    process.name|endswith:
      - '\cmd.exe'
      - '\powershell.exe'
      - '/sh'
      - '/bash'
  condition: 2 of selection_*
falsepositives:
  - Approved administration, deployment, maintenance or incident-response activity
level: high
Deployment Queries
SPL:
index=security (event_category=network OR event_category=web OR event_category=authentication OR event_category=process) | eval entity=coalesce(dest,host,user,src), action=coalesce(http_method,action,process_name), result=coalesce(status,http_status) | bucket _time span=5m | stats count dc(src) as sources dc(action) as actions values(result) as results by _time entity | eventstats avg(count) as baseline stdev(count) as deviation by entity | where count > baseline + (2*deviation)

EDR normalized:
(event.category == "process" AND process.parent.name != null AND process.name IN ("cmd.exe","powershell.exe","sh","bash")) OR (event.category == "network" AND network.direction == "inbound")

XDR normalized:
(event.category:process AND process.parent.name:* AND process.name:(cmd.exe OR powershell.exe OR sh OR bash)) OR (event.category:network AND network.direction:inbound)
OBJECTIVE
Detect and prioritize behavioral evidence consistent with suspicious activity targeting a network exposed surface associated with Ultralytics.

IMPORTANT ANALYTIC CONSTRAINT
This detection is predictive and evidence-gathering oriented. Do NOT assume that exploitation is occurring.

No specific vulnerability identifier is established by this forecast. Do NOT invent or infer a CVE from vendor identity, severity, exposure or observed errors.

THREAT MODEL
Prioritize activity compatible with:

remote network access;
no prior authentication or privileges required;
user interaction required;
low attack complexity;
potential high confidentiality, high integrity, high availability impact.

TARGET SCOPE
Prioritize Ultralytics infrastructure and systems associated with Ultralytics services, management interfaces, appliances, gateways, application endpoints or other network-exposed components.

TELEMETRY TO CORRELATE
Analyze available:

network telemetry;
web telemetry;
identity telemetry;
endpoint telemetry;
service and application errors;
asset exposure and role context.

PRIMARY OBSERVATIONS

NETWORK
Identify inbound connections, especially unusual sources, bursts, increasing frequency, source-diversity changes, uncommon ports and repeated access against the same asset.

WEB
Identify suspicious POST, PUT or DELETE activity correlated with HTTP 400, 401, 403 or 500 responses, malformed requests, unusual paths, unusual parameters or multiple failures followed by behavioral change.

PROCESS EXECUTION
Prioritize a network-facing service temporally associated with child execution of cmd.exe, powershell.exe, sh, bash or another rare shell or interpreter. Increase severity when the parent is normally non-interactive.

IDENTITY
Look for authentication-state changes, unusual account creation, privilege changes, activity without a corresponding legitimate login and authentication behavior inconsistent with the preceding baseline.

CORRELATION
Use a rolling 5-minute window.

Create an elevated detection when at least TWO independent telemetry classes converge around the same target asset, identity, service or execution chain.

Give substantially greater weight to a plausible ordered sequence than to isolated exposure, scanning, errors or administrative activity.

BASELINE / ANOMALY ANALYSIS
For each target entity, compare current behavior against its historical baseline.

Consider:

event volume;
distinct source count;
distinct actions;
error or denial rate;
process rarity and parent-child rarity;
identity, privilege, file or configuration changes.

Treat activity satisfying:

current_count > baseline_mean + 2 * baseline_standard_deviation

as supporting anomaly evidence, not standalone proof of compromise.

SCORING

LOW:
Only expected exposure or one weak, isolated observation is present.

MEDIUM:
Activity is anomalous relative to the asset or identity baseline.

HIGH:
Two independent telemetry classes converge within the correlation window.

CRITICAL:
Suspicious initial activity is followed by unusual process execution, privilege modification, persistence, sensitive file change, configuration change or outbound activity.

FALSE-POSITIVE CONTROL
Before escalating, evaluate whether the activity can reasonably be explained by:

approved administration;
deployment;
vulnerability scanning;
monitoring;
maintenance;
incident-response activity;
known automation;
authorized security testing.

Do not suppress solely because one event resembles legitimate administration. Evaluate temporal sequence, source context, asset role, rarity and cross-telemetry correlation.

REASONING REQUIREMENT
Distinguish explicitly between:

EXPOSURE
The asset or execution surface is reachable, present or available.

SUSPICIOUS ACTIVITY
The surface is receiving anomalous requests, access attempts, inputs or state changes.

POST-ACCESS EVIDENCE
Endpoint, process, identity, file, configuration or outbound-network telemetry indicates that the suspicious activity may have produced an effect.

Never classify EXPOSURE alone as successful exploitation.

OUTPUT
Return:

{
  "verdict": "BENIGN | EXPOSURE | SUSPICIOUS_ACTIVITY | POSSIBLE_EXPLOITATION | HIGH_CONFIDENCE_COMPROMISE",
  "confidence": 0-100,
  "severity": "LOW | MEDIUM | HIGH | CRITICAL",
  "target_asset": "",
  "time_window": "",
  "observed_signals": [],
  "correlated_signals": [],
  "anomalies": [],
  "process_chain": [],
  "network_sources": [],
  "identity_changes": [],
  "legitimate_explanations": [],
  "evidence_for": [],
  "evidence_against": [],
  "recommended_investigation": [],
  "reasoning_summary": ""
}

DECISION POLICY
Prefer evidence over prediction.

Do not claim exploitation from vulnerability severity, vendor history, forecast dates, exposure, errors or anomaly scores alone.

Escalate toward POSSIBLE_EXPLOITATION only when telemetry supports a plausible causal sequence such as:

external inbound request
-> Ultralytics-associated network-facing service
-> anomalous response or service behavior
-> unexpected child process, identity change, persistence or outbound activity

Escalate toward HIGH_CONFIDENCE_COMPROMISE only when multiple independent post-access signals corroborate the sequence.
Predictive Risk Analytics Both charts use only predictions that later received normalized vendor and temporal-window corroboration. The lines show when the same cohort was inferred and subsequently corroborated. The bars show measured lead time for the most recent corroborations. No arbitrary scale conversion is applied.
A single evidence cohort showing predictive signal formation first and independent corroboration later
Recent Corroborated Lead Time (days · newest evidence first)
Methodology
LOGFORCE derives this issue by combining active pre-disclosure advisory signals with the confirmed-exploitation baseline. The model ranks lead time, severity, exposed surface, vendor-family history and runtime behavior potential, then emits both current criticality logic and predictive SIGMA logic.
Strategic Outlook
The operational objective is to act inside the forecast window: isolate critical surfaces, increase telemetry depth, attach LOGFORCE sensing to the relevant runtime lanes and prepare response logic before stable IoCs arrive.